
A Primer on Health Economics
The objective of this technical paper is to provide a user-friendly primer on economic evaluation applied to aortic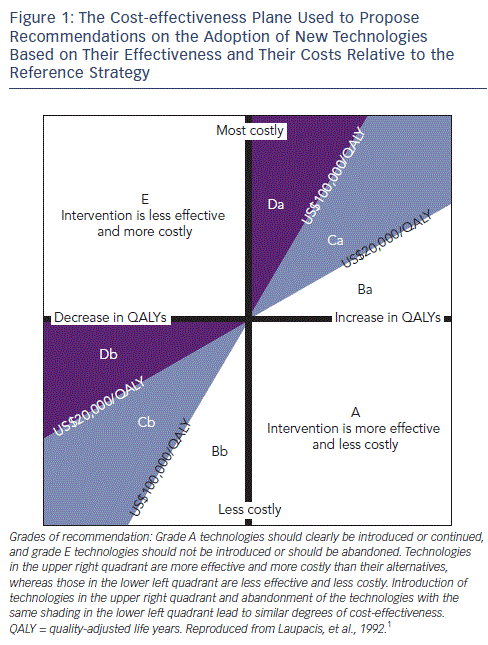 valve replacement. We will firstly present the general concepts of economic evaluation with a specific focus on the reasons why the results of academic research may not be relevant to the physicians in charge of managing a department or to hospital directors, and secondly illustrate those concepts with the practical example of transcatheter aortic valve implantation (TAVI).As cardiovascular diseases are a leading cause of mortality and make up around 10 % of total health expenditures in developed countries, any change in practice has an effect on medical expenditures. This explains the scrutiny to which interventional cardiology has been subjected, first on coronary interventions and later on the use of TAVI, which led in turn to questions about the effectiveness of this additional spending at the population level.
The general purpose of an economic evaluation in the field of healthcare is to relate the costs of a diagnostic or therapeutic strategy to its outcomes. The two components of the evaluation are thus a measure of effectiveness and an estimate of costs. Economic evaluation is currently both a decision tool and an evolving academic discipline.
The comparison of medical strategies that both use different resources and yield different outcomes requires a comparative approach on two criteria - the costs and the medical outcomes. Cost-effectiveness analyses compare strategies with costs expressed in monetary terms and outcomes expressed in a single medical unit; for example, lives saved, life years, or quality-adjusted life years (QALY). The latter takes into account the value that people would assign to a period of time lived in a certain condition (e.g. with the effects of a stroke). The final result of a cost-effectiveness analysis is often expressed as a ratio of cost to life years gained or cost to lives saved (termed incremental cost-effectiveness ratio [ICER]). A positive result means that the increase in costs results in a better medical outcome. The lower the cost-effectiveness ratio, the more efficient is the strategy.
Comparing any two strategies yields one of the following four situations:
In the case of the first two situations the decision is straightforward. In the last two situations a trade-off needs to be made between costs and effectiveness and strategies to be compared based on the cost-effectiveness ratio.1
Figure 1, completed by the explanatory Table 1, depicts the cost-effectiveness plane with each of the four situations. This representation is commonly used to assess innovations in interventional cardiology. The cost-effectiveness plane is used to propose recommendations on the adoption of new technologies based on their effectiveness and their costs relative to the reference strategy. What is the correct amount of money that a society should pay to prolong the life expectancy of one person by one year? Some countries have set an explicit threshold, others not. In 2003 the World Health Organization suggested that this threshold should be based on the per capita country gross domestic product (GDP). An intervention that prolongs life by one year at a cost <1 times per capita GDP is 'cheap' and a strategy that prolongs life by one year at a cost >3-5 times per capita GDP is 'expensive or even too expensive . In the UK the threshold usually mentioned is £30,000 or US$50,000 as shown in Figure 1.
2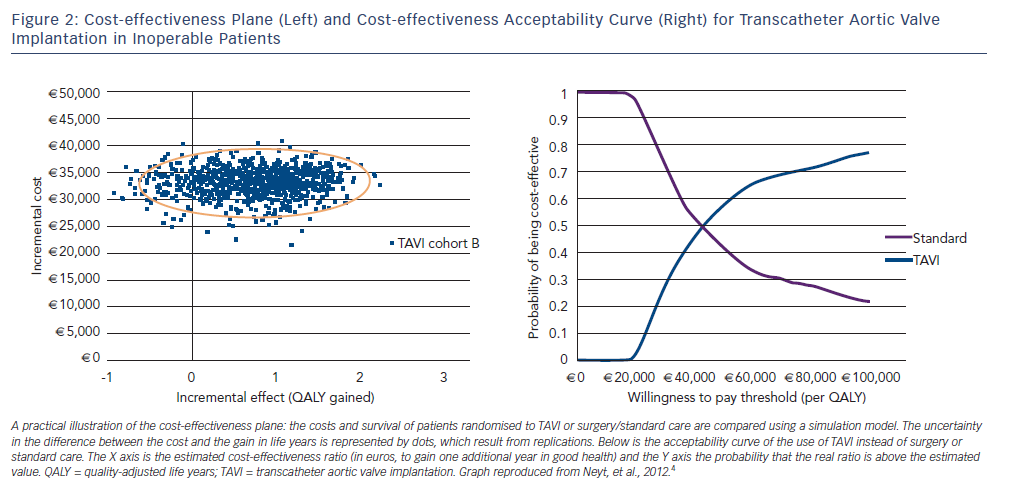 Other countries, such as the US, do not use such thresholds on the grounds that they result in discrimination between populations. However, there is a general consensus that cost information is important to inform comparative effectiveness research for policy decisions.3 This cost-effectiveness plane is widely used to study innovations in interventional cardiology, as shown in the next part of this chapter. The discussion on threshold for the adoption of technologies has been made more scientific by efforts to quantify uncertainty. Uncertainty concerns both the medical result (e.g. reduction of mortality or major adverse cardiac events) as well as the resources used (and possibly their costs). It is now common for economic evaluations of coronary intervention to use more sophisticated representations of uncertainty. Bootstrap replications, for example, show 1,000 possible ICERs, each obtained by taking a random effectiveness result and dividing it by a random cost result both chosen within a specified range.
Figure 2 shows the cost-effectiveness plane on which the difference in QALY and costs of TAVI versus surgical valve or standard treatment in high-risk patients has been materialised by 1,000 dots, each one representing a possible result, given the uncertainty in the Placement of AoRTic TraNscathetER Valves (PARTNER) trial results. On this graph, drawn from the trial results, TAVI appears to provide better outcomes at higher cost. The QALY benefit in favour of TAVI is shown by the fact that most simulations are on the right-hand side of the plane.4
It is possible to translate the uncertainty scatter plot into a more readable decision tool, known as the acceptability curve. To build the acceptability curve, the software counts how many dots are below a given cost-effectiveness threshold and produces a probability. An example of an acceptability curve is shown in the left part of Figure 2. In this case, there is a 70 % chance that TAVI is more cost-effective than standard treatment if the decision-maker (e.g. the government or Ministry of Health) accepts to pay over €60,000 to save one additional year of life in good health. If the decision-maker agrees to spend only approximately €40,000 to save one additional year of life in good health, both treatments are equivalent.4
An article on health economics would be incomplete if it left the reader with the impression that policy decisions result from the calculations described above. The framework for the analysis of how policy-makers use the information provided by health professionals or health economists is provided by Goddard et al. in their article on 'priority setting in health .5 The world of healthcare delivery is not limited to clinicians and economists; it includes other stakeholders such as politicians, payers, interest groups and the industry. Public and professional institutions seek to maximise their power and influence in the healthcare sector, and policy-makers seek to maximise their political support. Consumers (patients) are utility-maximising and healthcare providers (in the private sector) are profit-maximising. With this in mind, the processes of organisation and delivery of health services and technologies appear more complex than the application of the results of economic evaluations would predict.
Politicians select programmes that maximise votes or that minimise their personal or corporate risk of liability. They prioritise implementation of technologies that benefit a large share of the population (or the population whose support is most important for politicians). Patient interest groups will support the technologies that benefit their members and increase their legitimacy as patient advocates. This latter point implies that interest groups will also seek to expand the use of technologies to the largest possible population rather than to a selected group; often with the support of the industry, which thus increases its market share. Interest groups will also make use of the policy-makers concern for political support and render politically dangerous the denial of services. This is possible when the population concerned is very large, such as patients at risk for heart disease.
Hospital managers may not see the greater benefit of a new technology when it falls outside the perimeter of their hospital. For example, the cost computations described above use the academic guidelines, which mandate the estimation of costs from the viewpoint of the producer (e.g. the healthcare systems as a whole).6 This method of computation is not what managers have in mind because it aggregates resources within and outside the hospital and ignores financial incentives such as tariffs, fees and reimbursement. If the cost of TAVI is included in a diagnosis-related group (DRG), a high-volume hospital may negotiate discounts and therefore make a profit if ultimately the DRG reimbursement is higher than the cost of purchasing and implanting the TAVI. However, if the TAVI is reimbursed on top of a DRG at a national price including the discount, the incentive to perform TAVI may become negative. In a similar manner, the use of drug-eluting stents that reduce the risk of repeat stenosis may ultimately reduce healthcare costs for the system but not for the hospital, which is accountable for the revenues and expenditures related to each intervention.