
Catheter ablation therapy has been widely used for rhythm control in patients with atrial fibrillation (AF).1 Since the first report in 1994,2 several interventional techniques have been proposed for AF, including replication of the surgical Maze,2 targeting pulmonary vein (PV) foci,3 segmental ostial and circumferential PV isolation,4,5 ganglionated plexi ablation,6 linear lesions in the left atrium (LA),7 complex fractionated atrial electrogram (CFAE)-based ablation8 and a stepwise approach.9 PV isolation remains the cornerstone of paroxysmal AF ablation and has a high success rate. In persistent AF, its role is limited because of the additional involvement of LA substrate due to extensive electrical and anatomical remodelling. The understanding of the substrate maintaining AF leads to the concept of pre-existing specific fibrotic atrial cardiomyopathy. The presence of fibrosis causing changes in cellular coupling results in spatial nonuniform anisotropic impulse propagation, which is a potential cause of abnormal atrial activation underlying the initiation and perpetuation of reentrant arrhythmia-like AF.10,11 In view of these changes underlying persistent AF, several ablation strategies have been attempted to modify the atrial substrate. While there has been some improvement in clinical outcomes,6–9 factors such as undue radiofrequency (RF) application, long procedural duration and high incidence of post-procedural atrial tachycardia (AT) remain.12
Recently, AF mapping using activation13 or phase-based14 analysis of body surface potentials, has allowed potential visualisation of AF-driving substrate in the form of multiple wavelets and reentrant drivers. Prior knowledge of the main AF-driving regions has been shown to facilitate the ablation procedure in patients with persistent AF.14
Non-invasive Body Surface Mapping Analysis for Atrial Fibrillation
From the previous investigations, multiple atrial wavelets, macroreentries and localised sources (focal or reentry) have been reported to lead to maintenance of AF.15,16 Electrical activities in the myocardium during AF can be mapped with electrode arrays in the in situ heart17 and voltage-sensitive fluorescent dyes in the isolated heart,18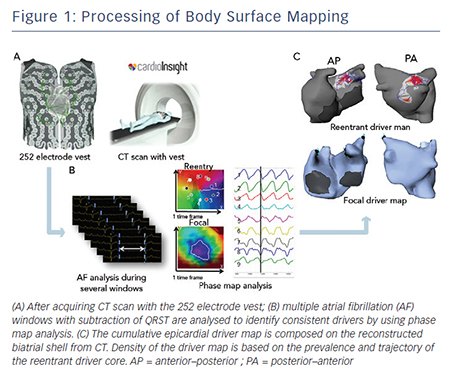 which demonstrate complex and often irregular activity. A study involving epicardial mapping of induced human AF demonstrated multiple dynamic wave fronts interacting with changing arcs of conduction block and slow conduction.19 Another recent study mapping chronic AF intraoperatively demonstrated short regular cycle length that could be consistent with a driver with irregular activation of the rest of the atrium.20 Although it is now well accepted that the irregular waveform is seen from an irregular and constantly changing activation sequence on the surface electrogram during AF, these drivers are practically difficult to detect with conventional techniques because of the continuous and intermittent spatiotemporal dynamicity of underlying sources.21,22 To assess driver activities, phase analysis has been applied to these signals. Due to the wavefront interactions leading to constant fractionation and collision, phase mapping provides an amplitudeindependent manner to characterise and visualise dynamic data.23 Non-invasive mapping enables panoramic beat-to-beat mapping of this dynamic rhythm using phase analysis.9,14
Electrocardiographic imaging, which non-invasively images cardiac electrical activity in the heart, has been developed recently.24–26 This novel modality can demonstrate reconstructed unipolar electrical potentials, electrograms and isochrones on the epicardium by using geometrical information from computed tomography (CT) and an inverse mathematical algorithm.27 Based on the inverse principle, the clinical utility of non-invasive body surface mapping in atrial and ventricular arrhythmias has been reported.28–31 Body surface mapping is undertaken by using a commercially available system (ECVUETM, Cardioinsight Technologies). After acquiring 64 section multi-detector CT images with a vest of 252 body-surface electrodes positioned on the thorax and upper abdomen, epicardial unipolar electrograms are reconstructed on a patient-specific biatrial geometry.27 AF electrograms are acquired during a long ventricular pause – spontaneous or diltiazem-provoked. QRST is subtracted and AF maps are created using specific algorithms combining wavelet transform and phase mapping applied to the reconstructed epicardial potentials. Activation maps are computed using traditional unipolar electrogram intrinsic deflectionbased (dV/dT)max method. The AF drivers can be classified into two categories: (i) focal activation with centrifugal propagation from a point and (ii) reentry/rotor demonstrating rotated wave with full-phase propagation around a functional or anatomical centrepoint. The core and trajectory of reentrant drivers and focal sources are depicted on the patient-specific biatrial geometry (see Figure 1A–C).28,32 The number of foci and reentry through the total duration of all AF windows are displayed on cumulative driver-density maps.