
Optical Coherence Tomography – a New Era of Intracoronary Imaging
OCT was first developed by two Japanese researchers at the Yamagata University (Japan) and subsequently at the Massachusetts Institute of Technology in the US in 1991. In vitro OCT was initially performed in the retina but adopted in the coronary artery later in the same year.1,21 Instead of ultrasound (like IVUS), OCT uses near-infrared light, which is absorbed by water, lipids and erythrocytes (see Figure 2). The high-resolution of OCT has allowed use of this technology for both clinical and research purposes.21 OCT has widely been used in the assessment of coronary anatomy over the last decade, and has a wide range of clinical applications including coronary plaque anatomy, post-PCI stent position and malapposition. Within research, OCT has been 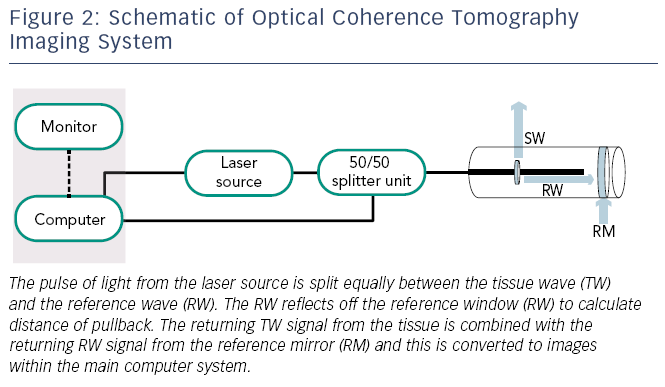 able to improve the evaluation of stent endothelisation post-implantation. Although initial OCT systems consisted of time-domain optical coherence tomography (TD-OCT) technology, this has been surpassed by frequency-domain optical coherence tomography (FD-OCT) technology.
Current OCT catheters are 3.2 Fr flexible short monorail systems with an optical emitting transducer that emits a near-infrared wavelength of about 1,300 nm. Unlike the IVUS catheter, the OCT catheter transducer lies 20 mm behind the distal marker. The transducer contains optical fibres with a micro-lens transducer that is placed beyond the target lesion along a standard guidewire. The OCT catheter does not move during image acquisition, instead the transducer moves back inside the central part of the catheter. The catheters have an automated pullback system at a rate of 25 mm per second with an image range of 50–70 mm when adequate coronary preparation has occurred. As the light source is easily absorbed by blood there is a need for coronary preparation prior to image acquisition. The use of pure contrast through a manifold to prepare the coronary artery with total blood removal is generally recommended with most left coronary systems requiring 10–14 mls and right coronary arteries 8–10 mls. The OCT system consists of an OCT imaging catheter (ImageWite TM, St Jude TM, St Paul, Minnesota, US) and an OCT system console, which contains the optical imaging engine and computer signal acquisition (M2/M3 CV OCT Imaging System, LightLab Imaging, Inc, Westford, Massachusetts, US).
Image Acquisit ion Limitations of Optical Coherence Tomography
Due to the need for complete coronary preparation, if any blood pooling remains, a high signal will remain within the image distorting the final image. In addition, as the guidewire does not run through the entire length of the OCT catheter, all images will have a silhouette of the guidewire with reduction of image quality in these areas (see Figure 3).
Safety of Optical Coherence Tomography
The relatively low energy used in OCT (5.0–8.0 mW) does not cause functional or structural damage to the coronary tissue. The main safety concern with OCT is the use of a contrast bolus in coronary preparation – however, studies have shown that no patients suffered contrast-induced nephropathy, but there is a relatively small risk of coronary spasm and electrocardiogram (ECG) changes during contrast administration.22
Assessment of Coronary Lesions with Optical Coherence Tomography
Plaque Characterisation
Since there is greater spatial resolution with OCT compared with IVUS (see Figure 3), OCT can provide more detail regarding the microstructure of the vessel wall and specifically OCT has been shown to identify TCFA, a feature not possible by IVUS. Studies have shown a high degree of correlation between OCT imaging and fibrous cap thickness on histologic evaluation.1,17,23 In addition, OCT can identify TCFA by measuring the thickness of the fibrous cap and the arc of the lipid-rich plaque.24–26 Lipid pools are less sharply delineated than calcification and show lower signal intensity. Lipids also exhibit more heterogeneous backscattering than fibrous plaques.27,28
OCT has been shown to be helpful in determining prognosis by identifying vulnerable plaques. A prospective study of the characteristics of non-culprit lesions in 53 patients with coronary artery disease undergoing PCI showed that TCFA (as assessed by OCT) and the presence of micro-channels had a significant correlation with plaque progression (defined as >0.4 mm increase in minimal luminal diameter) at a seven-month follow-up.29
Thrombus
Thrombus is well visualised by OCT with the technique able to distinguish between different thrombus phenotypes.25,26,30 OCT images for white thrombi (composed of platelets and leucocytes) produce a signal-rich mass whereas red thrombi (containing mainly erythrocytes) produce high backscattering protrusions with strong signal attenuation.31 If there is a large red thrombus, then this may interrupt the visualisation of the characteristics of an underlying plaque due to signal attenuation. It is possible to misinterpret mural thrombi as lipid-rich fibroatheroma, due to similar OCT single attenuation patterns produced by these two plaque components. Therefore, thorough examination of the structures and surface are required to differentiate between these two pathologies.
Vessel Sizing
OCT allows clear delineation between the lumen and vessel wall, although due to shallow penetration there may be a limit in the detail of the whole vessel structure visualised as compared with IVUS imaging.32 OCT also provides accurate measurement of reference lumen diameters with studies showing that for proximal culprit lesions, TD-OCT measurements were almost identical to those measured with IVUS.33
Optimising Percutaneous Coronary Intervention
OCT allows detailed evaluation of strut apposition to the vessel wall and stent expansion after stent deployment. As the infrared light cannot penetrate into the metal struts of the stent, the luminal surface shows a strong reflection with shadowing behind the struts and consequently improves the visibility of individual stent struts. After stent deployment, OCT allows visualisation of stent edge dissection, tissue protrusion and incomplete stent apposition that may not be detected by either IVUS or angiography alone.33,34 OCT has also been used as one of the primary imaging modalities for follow-up evaluation of several bioabsorbable vascular scaffolds (BVS), which are being studied in clinical trials. A recently published study35 evaluated 100 lesions from 73 patients comparing BVS with an equal number of matched lesions treated with second-generation DES. OCT of these lesions showed a significantly higher rate of tissue prolapse and higher rates of incomplete strut apposition at the proximal edge in the BVS group. However, there was no difference inthe overall rates of incomplete strut apposition. Therefore using OCT, this study demonstrated that BVS had similar post-procedure area stenosis and minimal lumen area as second-generation DES. Another study, the ABSORB study,36 investigated 30 patients with a single de novo coronary artery lesion treated with BVS, who were followed up for two years clinically and with multiple imaging methods including OCT. At two years after implantation, 34.5 % of strut locations had no discernible features detected by OCT, suggesting a significant reduction in restenosis as well as reducing the risk of late thrombosis.
Stent area measured by OCT could potentially be an alternative endpoint of PCI. This is because OCT has helped to predict no reflow26 post-PCI, based on the presence of TCFA. The clinical significance of these OCT findings and whether they warrant further intervention remains unclear;with a small natural history study showing that these findings resolved without significant restenosis or thrombus formation at six-monthfollow-up.37 To date, no studies have been completed investigating the role of OCT in optimising PCI for non-ST-segment elevation acute coronary syndromes (NSTEACS). The Does Optical Coherence Tomography Optimise Results of Stenting (DOCTORS) study will randomise 250 patients to have OCT-guided angioplasty or angioplasty alone. In addition to the safety of OCT in angioplasty for NSTEACS, the study will also investigate whether OCT yields useful additional information beyond that obtained by angiography alone and whether this information changes interventional strategy.38
Finally, a recent study investigated the use of OCT to guide the management of patients with ACS and large thrombus burden.39 The study involved 852 patients with ACS. Of these patients, 101 had large thrombus burden and underwent thrombectomy to restore Thrombolysis In Myocardial Infarction (TIMI) 3 flow. These patients subsequently had OCT on days 0–2 (acute), days 3–6 (early) and days 7–30 (late). The study found that the delayed group had reduced thrombus burden, resulting in 38 % of patients not requiring stent implantation. This suggests that OCT identified culprit lesion morphology not discerned by angiography alone and therefore OCT facilitated PCI decision-making.
Assessment of Neointimal Coverage with Optical Coherence Tomography
Strut coverage is an important surrogate risk factor of stent thrombosis. According to IVUS examinations, most DES appear uncovered by neointima; however, the limited resolution of IVUS makes it difficult to calculate the thickness or even extent of neointimal coverage. Using OCT, strut coverage is clearly seen and both the coverage of individual struts and the thickness of neointimal coverage can be assessed accurately.40 In one study, at six-months follow-up, 89 % of sirolimus-eluting stents (SES) lesions were covered by thin neointima, and 64 % of the stent struts were covered with neointima that had a thickness of less than 100 μm (which would be undetectable by IVUS).40
Even though the introduction of DES has led to reduced rates of restenosis, this complication following PCI still occurs and our understanding of its pathophysiology is still poor. OCT has helped advance our understanding, with studies demonstrating that stent resteno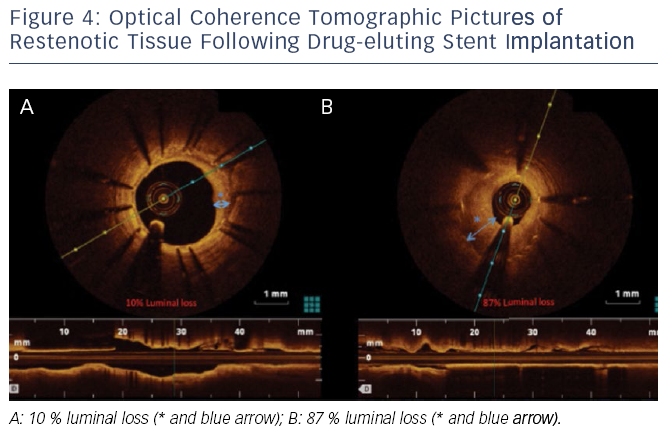 sis is not homogenous. Furthermore, OCT imaging allows separation of restenotic tissue into homogenous, layered and heterogeneous groups. This was demonstrated in a study where paclitaxel-eluting stent restenosis could be easily classified into these three groups using OCT.41Figure 4 demonstrates the sensitivity of OCT in characterising the extent of restenosis after DES implantation.
OCT has been increasingly used as an endpoint in clinical trials of newer generation DES, e.g. the Limus Eluted from A Durable versus Erodable Stent coating (LEADERS) randomised trial comparing a biolimus-eluting stent (BES) with SES. Here, 56 consecutive patients underwent OCT during angiographic follow-up at nine months. At an average follow-up of nine months, strut coverage was more complete in patients allocated to BES compared with those with SES.42 However, whether uncovered stent struts visualised by OCT directly relate to late stent thrombosis after PCI remains largely unclear.
Optical Coherence Tomography Observations of Very Late Stent Thrombosis After Drug-eluting Stent Implant
It is believed that very late stent thrombosis may be due to delayed arterial healing as well as incomplete endothelialisation following stent implantation.43 OCT has been used to observe very late stent thrombosis 29 months after SES implantation. Here OCT showed multiple inter-strut ulcer-like appearances and late strut malappositions.44 These changes could represent OCT signs of very late stent thrombosis.
Although these observations are important to understand differences in stent design, further studies are required to determine the clinical significance of these findings, and in particular, whether information obtained using OCT can be predictive in identifying patients at risk of stent thrombosis or restenosis. Large-scale, prospective studies are needed to address clinical questions such as the relationship between clinical outcome and DES deployment, vascular healing, the time course of endothelial stent coverage, as well as the threshold for stent coverage and late-stent thrombosis.