
Novel Techniques of FFR Calculation
By taking advantage of the exceptional capabilities of modern modalities for coronary imaging coupled with CFD methodologies, various investigators have presented alternative methods of FFR calculation. In these studies the imaging modality, either a multislice computed tomography (CT) scanner,20,21,26–29 an angiography unit capable of rotational coronary angiography,16 or 3D quantitative coronary angiography (3DQCA) were employed for the acquisition of vessel models of diseased coronary arteries. On the acquired models suitable boundary conditions are applied, the blood is appropriately modelled and the incompressible Navier-Stokes equations are solved with a finite element method using CFD techniques and appropriate hardware. From the simulation results the “virtual” fractional flow reserve is calculated.
Coronary Computed Tomographic Angiography Derived FFR
Coronary computed tomographic angiography (CCTA) has emerged as a noninvasive test that assesses anatomic CAD stenosis severity.30 However, CAD as determined by CCTA demonstrates a poor relationship to lesion-specific ischaemia, with the majority of high-grade stenoses detected by CCTA not being associated with ischaemia.31–34 These findings have raised concerns that widespread use of CCTA might result in excess referral of patients to ICA and unnecessary revascularisation of nonischaemic coronary lesions.35,36 Thus it would be desirable to be able to calculate the functional severity of CAD stenoses with CCTA. Computational fluid dynamics, as applied to CCTA images, provide the possibility for non-invasive quantitation of coronary blood flow, flow velocity and pressure in the major epicardial coronary arteries. A dedicated algorithm has been developed which facilitated the derivation of FFR based of CCTA (FFRCT) (HeartFlow™; HeartFlow Inc., Redwood City, CA, USA).37,38
CCTA can provide a credible coronary geometric model, including patient specific branching and pathology. Based upon this geometric information, a volumetric finite element mesh with anisotropic refinement and boundary layers is generated in order to compute numerical results. Using a proprietary algorithm the heart-vessel interaction can be defined, whereas time-varying coronary resistance for each coronary branch can be determined relative to intramyocardial pressure and microvasculature impedance. This latter component can be represented by a so-called lumped (zerodimensional) parameter model, which resembles an electric circuit, including resistive and capacitive elements.11 The complex fluid properties of the blood are entered into t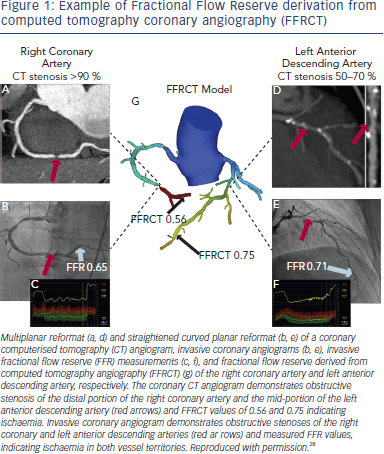 he model, in order to refine the computations.
The methodology of FFRCT computation is based on three key principles20: (i) the coronary supply meets myocardial demand at rest; (ii) the resistance of the microcirculation at rest is inversely but not linearly proportional to the size of the feeding vessel; (iii) the microcirculation reacts predictably to maximal hyperaemic conditions in patients with normal coronary flow. FFR can be computed from typically acquired CCTA scans without any modification of CCTA protocols, additional image acquisition, administration of medications, or additional radiation to the patient (see Figure 1).
In order to compute FFR, 3D models of the coronary tree and ventricular myocardium are reconstructed from standard coronary CT image datasets and the major epicardial vessels and plaque are segmented, luminal surfaces are identified, and visible side branches are added to the model. Blood is usually modelled as a Newtonian fluid and the incompressible Navier- Stokes equations are solved, subject to appropriate boundary conditions. Since coronary flow and pressure are unknown a priori, a method to couple lumped parameter models of the microcirculation to the outflow boundaries of the 3D model is used to represent the resistance to flow during simulated hyperaemia for each coronary branch of the segmented CT model.
The feasibility and diagnostic performance of the method were evaluated in the Diagnosis of ischaemia-causing stenoses obtained via noninvasive fractional flow reserve (DISCOVER FLOW) study. This trial was conducted at five hospitals internationally, which prospectively enrolled 103 patients (159 lesions) who had undergone coronary CCTA.20 All patients underwent invasive angiography with FFR. Computed FFR values were found to have a very high degree of correlation with invasively measured FFR. As expected, coronary CT angiography alone showed high sensitivity of 91 % and negative predictive value (NPV) of 89 %, but comparatively low specificity of 40 % and positive predictive value (PPV) of 47 % for the identification of lesion-specific ischaemia defined as an FFR ≤0.80. By comparison, FFRCT produced sensitivity of 88 % and NPV of 92 %, similar to those of coronary CT angiography, but much higher specificity of 82 % and PPV of 74 %, resulting to an overall accuracy increase of 25%.