
Rotational Coronary Angiography Derived FFR
A proof-of-concept, single-site study explored the feasibility of FFR estimation on 19 patients with stable coronary artery disease using CFD techniques and angiographic images acquired from rotational angiography (RA).16 The workflow has been developed to create sim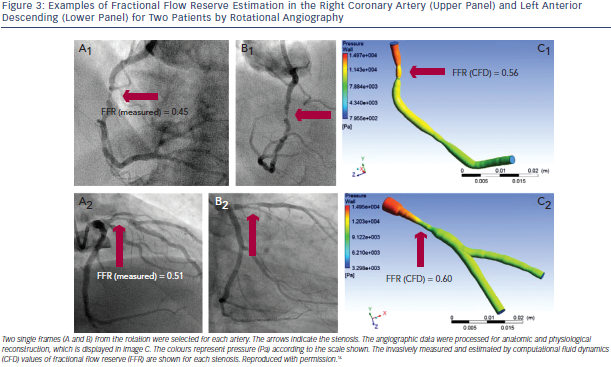 plified virtual models of the major epicardial arteries with or without one major side branch from a single rotational coronary angiogram. With a CFD solver and with generic boundary conditions,23 the pressure and flow solution can be calculated (see Figure 3). The estimated FFR values agree well with the measured values, with an overall average deviation from the measured values of ± 0.06. Lesions requiring PCI (measured FFR <0.80) were identified from nonsignificant lesions (measured FFR >0.80) with 97 % accuracy. This methodology does not require the induction of hyperaemic flow, additional procedure time, the hazard of passing an intracoronary wire, or additional equipment, training or cost. However, the authors acknowledge the study can be only considered as hypothesis generating since it is hampered by various limitations. The most evident being the limited patient cohort and the fact that only a limited subgroup of cases (n= 3) had an measured FFR falling between 0.75 and 0.85. In several patients with measured FFRs equal to 1.0 the calculated value varies between 0.85 and 0.95.
The accuracy of the methods seems to be lesion severity dependent since for haemodynamically insignificant stenoses the calculated FFR values are more likely to be accurate whereas for most lesions with FFR <0.80, the virtual FFRs underestimates severity. Other limitations are the adoption of generic rather than patient specific boundary flow conditions and the long computational time currently required to process data. Inherent limitation is the requirement of a rotational coronary angiogram which is an invasive procedure not universally available and cumbersome to perform.
3D QCA and TIMI Frame Count Derived FFR
A methodology for FFR computation based on 3D quantitative coronary angiography (QCA) and thrombolysis in myocardial infarction (TIMI) was recently presented.19 The methodology uses 3D QCA (QAngio® XA 3D, Medis Special BV43,44) to obtain the anatomical models and applies CFD subsequently, using the hyperaemic flow rate to calculate FFRQCA. To calculate flow rate, the contrast medium transport time in the reconstructed vessel was measured on hyperaemic projections using TIMI frame count. The mean volumetric flow rate (VFR) at hyperaemia was derived using the lumen volume of the reconstructed coronary tree divided by the mean transport time. The same calculation was applied to the baseline angiography, from which the baseline VFR was obtained. Coronary flow reserve (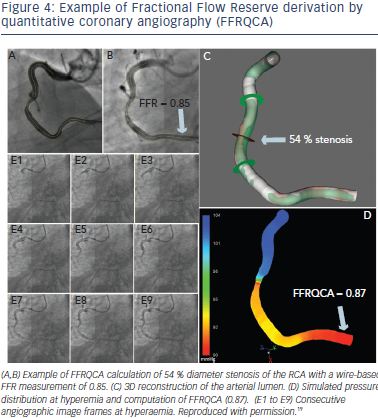 CFR) was derived by dividing the hyperaemic VFR by the baseline VFR. For the CFD part of the methodology, blood was modelled as incompressible Newtonian fluid and blood’s density and viscosity were derived using the haematocrit value of individual patients. The mean hyperaemic VFR and the mean pressure at the guiding catheter tip were applied at the inlet, whereas outflow (fully developed flow) condition was applied at the outlets. After simulation, FFRQCA was defined as the mean pressure at the outlet divided by the mean pressure at the inlet (see Figure 4). The diagnostic performance of the computed FFRQCA was assessed using wire-based FFR as reference standard on 77 vessels in 68 patients with intermediate coronary stenoses (40–70 % diameter stenosis by visual estimation). FFRQCA correlated well with FFR (r =0.81, p < 0.001), with a mean difference of 0.00±0.06 (p=0.541). Applying the FFR cutoff value of ≤0.8 to FFRQCA resulted in 18 true positives, 50 true negatives, four false positives and five false negatives.
FFRQCA provides a more patient-specific approach than previously presented methodologies since rather than assuming that microcirculation reacts predictably to maximal hyperaemic condition, it calculates hyperaemic directly on the angiographic projections during hyperaemia. It also appears that FFRQCA is more accurate than FFRCT which, according to the investigators, can be attributed to the higher image spatial resolution of conventional coronary angiography versus coronary computed tomography angiography, as well as by the presence of downstream microcirculatory disease. Another plausible advantage of the technique is the processing time which according to the authors is less than 10 minutes, which implies that it has the potential to be adopted in clinical practice if the methodology is further optimised. Limitations of the study include its limited patient cohort and validation exclusively on de novo lesions. Another limitation of the method is that since 2D projections are used to reconstruct the 3D arterial model, vessel overlap, foreshortening and poor image quality may hamper the process.