
Iron Deposition Assessment
Patients with haemochromatosis are in great risk of iron overload. ‘T2-star’ (T2*) technique, assessed by CMR, is a non-invasive method for measuring liver and cardiac iron deposition (see Figure 2). A significant curvilinear, inverse correlation between iron concentration measured by biopsy and liver T2* was found. 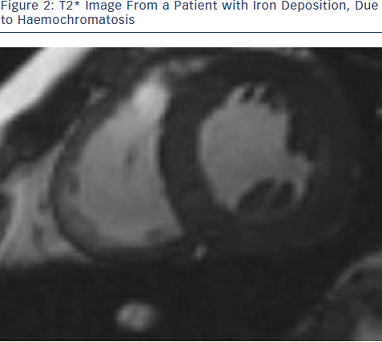 Myocardial iron deposition can be reproducibly quantified using T2*. This is the most significant variable for predicting a requirement for targeted treatment of myocardial iron overload and it cannot be replaced by serum ferritin, liver iron or any other measurement. Excellent T2* reproducibility between scanners produced by two different manufacturers supports the feasibility of widespread implementation of the technique. Myocardial T2* seems to be the most sensitive and easily reproducible index of myocardial iron deposition currently available.43
Therapeutic phlebotomy and iron chelation are the cornerstones of haemochromatosis therapy. The average survival is less than a year in untreated patients with severe cardiac impairment. However, if treated early and aggressively, the survival rate approaches that of the usual population with heart failure. CMR, using T2* measurements, can quantify myocardial iron overload and response to iron reduction therapy by serial imaging evaluation.43
Aortic Stiffness
Aortic distensibility and aortic pulse wave velocity (PWV) are two parameters closely related to the bio-elastic function of the aorta. Quantification of aortic distensibility and PWV by CMR has been shown to be accurate and reproducible and can identify early cardiovascular disease in asymptomatic patients. Gradient echo cine CMR has been applied to assess aortic distensibility and phase-contrast cine CMR to evaluate aortic PWV and to quantify aortic flow.44
In type 1 diabetes there are strong adverse effects of hypertension, chronic hyperglycaemia and macroalbuminuria on aortic distensibility.45 In another study, a combined CMR assessment of aortic PWV, aortic distensibility and heart function reveals abnormal PWV and distensibility in T2DM that is independent of blood pressure and correlates with diastolic LV function.46 Additionally, aortic elastic function is abnormal in obese subjects without other cardiovascular risk factors.47
Finally, juvenile idiopathic arthritis (JIA) is associated with increased aortic stiffness that might suggest subclinical atherosclerosis.48
Epicardial Fat
Fat deposits are often found around the heart. This fat can be separated into different compartments. Epicardial fat (EF) is the adipose tissue accumulated 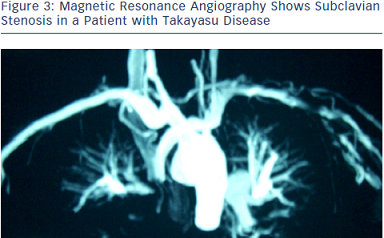 between the visceral pericardium and the myocardium, without a structure or fascia separating it from the myocardium and the epicardial vessels. EF has a variable distribution, being more prominent in the atrioventricular and interventricular grooves and right ventricular lateral wall.49 Adipocytes’ infiltration into the myocardium as well as triglyceride infiltration into myocytes may also occur.
The fat located on the outer surface of the fibrous pericardium differs from EF in their biochemical, molecular and vascular nutrition properties. It is nourished by the pericardiophrenic artery, a branch of the internal thoracic artery,49 while EF is nourished by the coronary arteries. The structure that delimitates these layers is the pericardium, seen on imaging tests as a thin layer around the heart, between 1.0 and 4.0 mm, of which visualisation is sometimes difficult.
CMR is considered as the gold standard for the assessment of total body fat and reference modality for the analysis of ventricular volumes and mass, thus making it a natural choice for the detection and quantification of EF.50 The total volume of EF can be estimated using the modified Simpson method, in which the epicardial tissue is contoured in each short axis at end of diastole. The interobserver reproducibility of EF volume measurement is superior to the EF thickness measurement (coefficient of variability of 5.9 % for the volumetric method and 13.6 % for EF thickness at the long axis); however, it is technically more difficult.50
In prepubertal and early pubertal obese children, EF is a significant marker of increased insulin resistance and associated cardiovascular risk.51 Additionally, subjects with type 1 diabetes have higher EF than non-diabetic subjects.52
Magnetic Resonance Angiography
Magnetic resonance angiography (MRA) is an imaging modality that comprises various techniques based on two concepts: methods relying on the natural flow 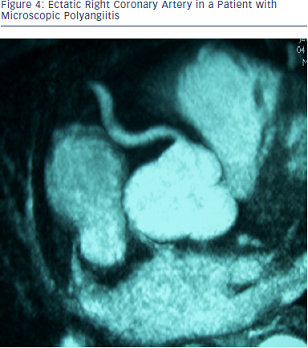 effects, the time-of-flight and phase-contrast technique, either in two- or three-dimensional acquisition mode and the more recently developed contrast-enhanced (CE) MRA methods.
A study in diabetic patients, using whole-body magnetic resonance imaging (WB-MRI) and whole-body magnetic resonance angiography (WB-MRA), found a prevalence of 49 % for peripheral artery disease, 25 % for myocardial infarction, 28 % for cerebrovascular disease and 22 % for neuropathic foot. In all vessels, at least 50 % of pathologies were previously unknown.
Additionally, myocardial infarction, chronic ischaemic cerebral lesions and atherosclerotic disease were significantly more common in diabetic than in controls.53 MRA has also been applied in the evaluation of great vessels in large vessels vasculitis, such as Takayasu disease (see Figure 3).54
Coronary magnetic resonance angiography (CMRA) has already been applied in different systemic diseases. In diabetes mellitus, CMRA may detect early coronary artery changes.55 In patients with systemic antineutrophil cytoplasmic antibodies (ANCA)-related vasculitis, CMRA detected ectatic and/or aneurysmatic coronary arteries (see Figure 4).56 Additionally, in Kawasaki disease, CMRA is a useful tool for a radiation free serial coronary artery evaluation.57 Finally, in HIV patients, CMRA may facilitate the early detection of CAD.58