
Studies Comparing iFR with FFR
The VERIFY study demonstrated that, in a consecutive cohort of 206 coronary stenoses of intermediate severity and compared with the FAME trial FFR cut-off value of ≤0.80, the diagnostic accuracy of iFR ≤0.80 was only 60 %.21 The ADVISE clinical registry reported that in 339 stenoses a different iFR cut-off of 0.89 provided a cla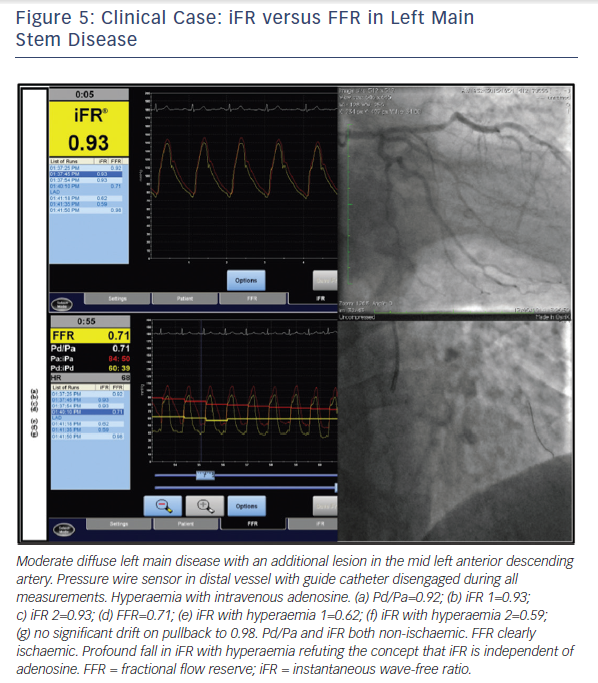 ssification agreement between iFR and FFR of 80 % for the same FFR cut-off value of ≤0.80.22 The ADVISE 2 study compared iFR and FFR in 690 coronary stenoses.23 This dataset was used to derive a proposed hybrid strategy, which correctly classified 94 % of lesions by accepting an iFR>0.93 as being negative (non-ischaemic) and an iFR<0.86 as positive (ischaemic) and only requiring FFR to be measured in lesions with iFR values in between these limits. Compared with an FFR for all strategy, this avoided the use of adenosine in 70 % of stenoses (65 % of patients) at the expense of making a different treatment decision in 1 in 16 lesions.23 The RESOLVE study was an independent core laboratory re-analysis of coronary pressure recordings from 1768 patients drawn from several studies including both ADVISE and VERIFY.24 In the RESOLVE study, the diagnostic accuracy of iFR was 80.4 % at an optimal iFR binary cut-off value of ≤0.90. It was also demonstrated that to achieve ≥90 % diagnostic accuracy at each extreme, the adenosine-free iFR range had to be restricted to ≤0.88 and ≥0.93, which was only applicable to 65 % of the study lesions.24 (Figure 5)
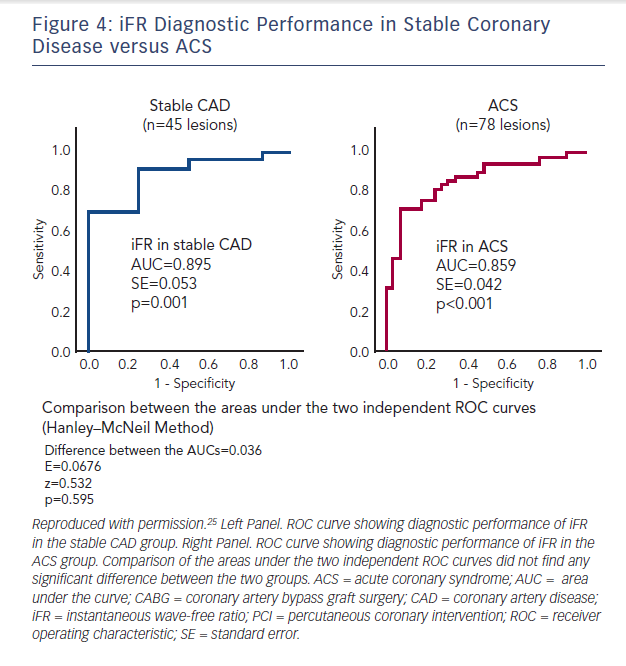
In a prospective study of 53 patients with an acute coronary syndrome (ACS) and 29 patients with stable angina, FFR and iFR in the non-culprit lesions of the ACS patients were calculated by two blinded operators.25 Using binary cut-off values, they demonstrated 81.3 % diagnostic concordance with FFR with positive and negative predictive values for iFR of 67 % and 89 %, respectively. Diagnostic accuracy was similar in both stable and unstable patient groups but was greatly improved by adoption of a hybrid approach with adenosine administration when iFR was 0.86–0.94, inclusive (Figure 4).25
It has previously been stated that the reason the VERIFY study reported an overall diagnostic accuracy for iFR versus FFR of only 60 % compared with 88 % in the ADVISE study is because in VERIFY, iFR was calculated using an in-house algorithm written in MatLab rather than the commercially available proprietary software.21 In fact, all raw data from VERIFY were provided to the independent core laboratory in the University of Columbia, New York for the RESOLVE study analysis. The correlation between iFR and FFR was stronger in the VERIFY study (r2=0.70 using the MatLab programme) than in the RESOLVE study (r2=0.66 using the proprietary software).24 Furthermore, the RESOLVE core lab analysis of the VERIFY dataset showed a mean difference in iFR values between the two different methodologies of -0.007, which is less than the mean difference between repeated measures of either parameter and therefore represents no difference at all.
iFR versus Perfusion Scintigraphy and/or Hyperaemic Stenosis Resistance as the Reference Standard
A retrospective analysis of 85 stenoses with adequate resting measurements from which to derive iFR out of a dataset of 299 combined pressure and doppler flow coronary physiology studies was performed and compared with a combined reference standard comprising myocardial perfusion scintigraphy (MPS) and hyperaemic stenosis resistance index (HSR).19 Both of HSR and MPS needed to be positive for the lesion to be considered ischaemic. The optimal ischaemic cut-off values were 0.66 mmHg/cm/sec for basal stenosis resistance (BSR) (sensitivity 84.6 %, specificity 79.7 %), 0.82 for iFR (sensitivity 69.2 %, specificity 88.1%), and 0.75 for FFR (sensitivity 88.5 %, specificity 76.3 %). There was no significant difference in AUC for either resting parameter (BSR or iFR) and FFR with respect to the combined reference standard (Table 1).19
Although HSR has previously identified as being highly sensitive and specific for ischemia,26 this particular study has a number 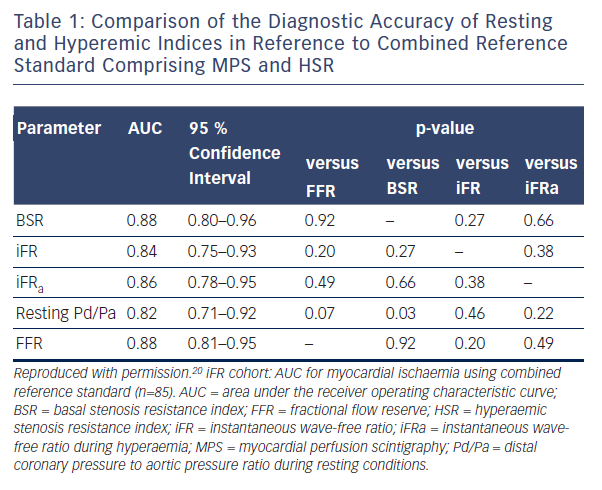 of significant limitations including a small sample size
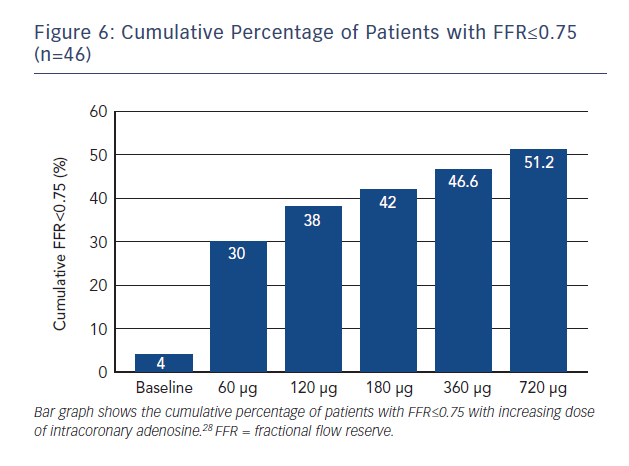 and the fact that the original validation of HSR was itself based on the MPS. This imaging modality has a high false-positive rate and importantly it was not repeated post revascularisation, which is possiby the most favourable means of assessing the diagnostic accuracy of any test for ischaemia. In addition, intracoronary adenosine was used to measure FFR in the low dose range of 20–40 μg. Previous studies have demonstrated that intracoronary doses of at least 100–200 μg are required to approximate the FFR achieved by IV adenosine infusion (Figure 6).27 This may lead to an underestimation of FFR, which in turn will erroneously increase the levels of agreement between the hyperaemic and non-hyperaemic indices. Sub-maximal hyperamiea would also be consistent with the absence of any difference between iFR and iFR during hyperaemia, a result entirely inconsistent with previously published data using IV adenosine. This study, however, showed no difference between Pd/Pa and iFR, consistent with the results of the RESOLVE meta-analysis.24
The CLARIFY registry reported data from 51 stenoses that had also been interrogated using combined pressure and flow velocity recordings.28 The authors defined HSR as the reference standard for ischaemia and determined that iFR at a cut-off value of <0.86 had an ROC AUC of 0.93 (95 % CI 0.85–1.00), while FFR<0.75 had an ROC AUC of 0.96 (95 % CI 0.89–1.00).29
iFR Versus Coronary Flow Velocity Reserve as the Reference Standard
In the JUSTIFY study, a retrospective dataset compared iFR with FFR in terms of their ability to predict coronary flow velocity reserve (CFVR).30 While CFVR is a useful parameter, it has generally been superseded by FFR due to marked dependence on systemic haemodynamics (heart rate, blood pressure, contractility) and difficulties in obtaining reproducible flow measurements. It is known that at least 30 % of lesions have discordant CFVR and FFR results and therefore it was unsurprising that FFR ROC AUC was 0.72 (CI 0.65–0.79). In this population iFR appeared to have a stronger correlation with CFVR with an ROC AUC of 0.82 (CI 0.76–0.88; p<0.001).30 The scenario of a lesion with a conventionally ischaemic FFR value but ‘preserved’ CFVR will be discussed later in this review.
Innovations with iFR
A particularly challenging group to assess physiologically are patients with tandem lesions or diffuse disease. In a proof-of-concept study coronary arteries were assessed using a motorised pullback system with calculation of iFR values per millimeter length of vessel.31 The investigators suggested that iFR may have the potential to be used in PCI planning for the determination of physiological lesion length as well as predicting the physiological response to PCI of single lesions when a number of tandem lesions are assessed.31 Given that iFR can be performed rapidly in multiple vessels, there are also potential practical and theoretical advantages in bifurcation disease.
Resting Pd/Pa
The relationship between resting gradient (Pd/Pa) and FFR was described in advance of the development of iFR in a retrospective analysis of 528 pressure-wire studies in 483 patients demonstrating a strong correlation between resting Pd/Pa and FFR (Spearman’s rank correlation coefficient 0.74).32 In fact, it was shown that a resting Pd/Pa of ≤0.87 had a positive predictive value (PPV) of 100 %, while a resting Pd/Pa of ≥0.96 had a negative predictive value (NPV) of 93.9 % in reference to FFR≤0.80. Similarly, when FFR ≤0.75 was used to define an ischaemic stenosis, Pd/Pa≤0.85 had a PPV of 95 %, while a resting Pd/Pa of ≥0.93 had an NPV of 95.7 %. The authors calculated that using these cut-off values, adenosine interrogation would have been avoided in 53 % of the FAME study population (FFR≤0.80) and 34 % of the DEFER study population (FFR<0.75), effectively coining the hybrid method for pressure wire assess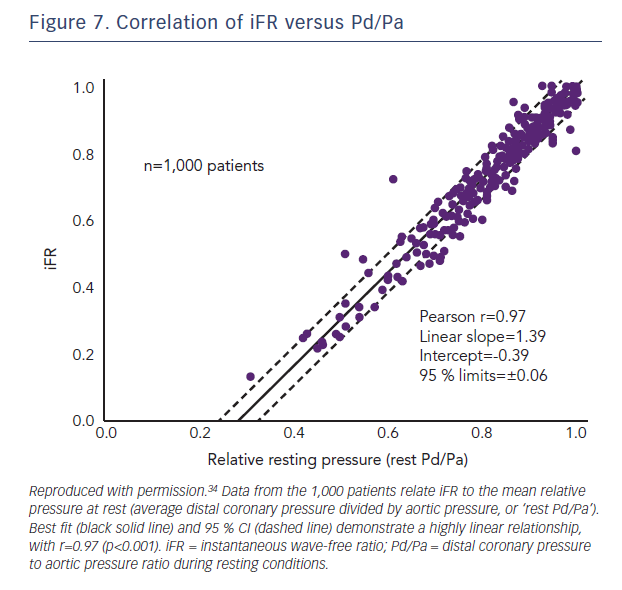 ment.32 Another, more recent, study retrospectively analysed 570 lesions in 527 patients applying a Pd/Pa adenosine zone range of 0.87–0.99 to achieve 100 % diagnostic accuracy with reference to FFR≤0.80, which would have avoided the use of adenosine in only 14.6 % of lesions.33 The authors reported that with a Pd/Pa adenosine zone of 0.88–0.96, 46.8 % of lesions would have been assessed without adenosine while maintaining 96 % agreement with an FFR for all strategy.
Resting Pd/Pa Versus iFR
In the large RESOLVE meta-analysis, which used an independent core-lab, no significant difference was found between iFR and Pd/Pa in reference to FFR≤0.80 with an overall diagnostic accuracy of 80 % for both indices (using the optimal ROC determined cut-off points of 0.90 for iFR and 0.92 for Pd/Pa.24 The relationship between iFR and Pd/Pa was explored again in a separate study of 1,000 patients with no observable diagnostic advantage of using iFR over Pd/Pa (Figure 7).34 These are important observations for operators who elect to trade off concordance with FFR against the need for hyperaemia, as although iFR analysis is currently only possible using proprietary software, all pressure wire systems are capable of providing resting Pd/Pa.